Thursday 26 May 2016

Basics of Nucleonic Gauges

PRINCIPLES OF NUCLEONIC GAUGES:

                        A nucleonic gauge consists of a suitable source (or a number of sources) of alpha, beta, gamma, neutron or X ray radiation arranged in a fixed geometrical relationship with one or more radiation detectors. Most of nucleonic gauges are based on a few most common nuclear techniques.


Natural gamma-ray technique
                      NCS based on natural gamma-ray technique utilize the correlation between natural gamma-ray intensity measured in one or more pre-selected energy windows and the concentration of particular elements (e.g. U, Th, K) or the value of a given parameter of interest (e.g. ash in coal).


Transmission:
                   
In the basic configuration of a transmission gauge the media to be measured is placed between the radioactive source and the detector so that the radiation beam can be transmitted through it (Fig.1). The media attenuates the emitted radiation (beta particles or photons) before reaching the sensible volume of the detector. Both source and detector can be collimated. The radiation intensity in the detector is a function of several parameter characteristics of the material.


FIG. 1. Principle of transmission method.


Dual energy gamma-ray transmission (DUET):

                        This technique is probably the most common nucleonic method for on-the-belt determination of ash content in coal. Ash content is determined by measuring the transmission through coal of narrow beams of low and high-energy gamma rays (Fig. 2). The absorption of the lower energy gamma rays depends on ash content, due to its higher average atomic number than that of coal matter, and on the mass per unit area of coal. The absorption of the higher energy gamma rays depends almost entirely on the mass per unit area of coal in the beam. Ash content is determined by combining measurements of the two beams. The determination is independent of both the bed thickness and the mass of the coal. The technique is also applicable to the analysis of complex fluid flow where multiple energy beams are usefully applied.


FIG. 2. Dual energy gamma ray transmission for on line measurement of coal ash concentration.


Backscattering:
                       Whenever a radiation beam interacts with matter a fraction of it is transmitted, a fraction absorbed and a fraction is scattered from its original path (Fig. 3). If the scattering angle is greater than 90o some photons or particles will come back towards the original emission point; the measurement of this radiation is the basis of the backscattering method.


FIG. 3. Principle of backscatter method.


Gamma-ray backscatter:
                          Measurement of radiation emitted by a stationary gamma-ray source placed in the nucleonic gauge and back-scattered from atoms of investigated matter enables some properties of this matter to be determined. The gamma-rays interact with atomic electrons resulting in scattering and absorption. Some of these gamma-rays emerge back from the investigated mater with degraded energy and intensity (count rate) characterizing the bulk density and the average chemical composition of the matter.


Neutron scattering (moderating): 
                         Fast neutrons of high energies emitted from the neutron source collide with nuclei of investigated matter reducing their energy. In general, neutrons lose more energy on collision with light nuclei than with heavy nuclei. Due to its light nucleus hydrogen is most effective in moderating neutrons from the source. As hydrogen is major constituent of most liquids detection of the liquid through container walls is possible, as well as measurement of the moisture (hydrogen density) of soils, coke or other materials.


Prompt gamma neutron activation analysis (PGNAA) and Delayed gamma neutron activation analysis (DGNAA):
                       When a material is bombarded with neutrons, interactions with nuclei result in the emission of high-energy gamma - rays, at a variety of energy levels. The nuclear reactions excite gamma-rays of energies specific to the target nucleus and the type of nuclear reaction. If the intensity and energy of these are
measured by means of a suitable spectrometric detector, the type and amount of an element present can be determined. The gamma-rays emitted may be classed as prompt, occurring within 10-12 seconds of the interaction, or delayed, arising from the decay of the induced radioactivity. (Fig. 4) The former gamma-rays are utilized in Prompt Gamma Neutron Activation Analysis (PGNAA) and the latter in Delayed Gamma Neutron Activation Analysis (DGNAA). The same probe can be used for both PGNAA and DGNAA elemental analysis (Fig. 5).


FIG. 4. Principle of PGNNA and DGNAA methods

Wednesday 25 May 2016

Instrument Noise

Introdution:
                  Noise is a variation in a measurement of a process variable that does not reflect real changes in the process variable.

                  A signal from a sensor can have many components. This signal will always have as one of its components the process value that we are measuring, but it may also contain noise. Noise is generally a result of the technology used to sense the process variable. Electrical signals used to transmit instrument measurements are susceptible to having noise induced form other electrical devices. Noise can also be caused by wear and tear on mechanical elements of a sensor.

                 Noise may also be uncontrolled random variations in the process itself. Whatever the source, noise distorts the measurement signal.

Effects of Noise: 
                   Noise reduces the accuracy and precision of process measurements. Somewhere in the noise is the true measurement, but where? Noise introduces more uncertainty into the measurement.

                    Noise also introduces errors in control systems. To a controller fluctuation in the process variable from noise are indistinguishable from fluctuations caused by real disturbances. Noise in a process variable will be reflected in the output of the controller.

Eliminating Noise:
                     The most effective means of eliminating noise is to remove the source. Reduce electrically induced noise by following proper grounding techniques; using shielded cabling and physical separation of signal cabling form other electrical wiring. If worn mechanical elements in the sensor are causing noise repair or replace the sensor.
                    When these steps have been taken and excessive noise is still a problem in the process variable a low pass filter may be used.

Low Pass Filters:
                     Smart instruments and most controllers have noise dampening features built in. Most of these noise dampeners are actually low pass filters.

                    A low-pass filter allows the low frequency components of a signal to pass while attenuating the higher frequency components.

                   Fortunately for us, noise tends to fall into the higher end of the frequency spectrum while the underlying process value tends to lie in the lower end.


Selecting a Filter by Cut-off Frequency:
Attenuation of a signal is a reduction in its strength, or amplitude. Attenuation is measured in
decibels (dB).

dB of attenuation = 20 log10(Amplitude In/Amplitude Out)

 For example: let’s say we have an amplitude ratio of 0.95 (the value of the signal out is 95% of
value of the signal in), the dB of attenuation would be:
                                                    20 log10 (.95) = −0.45

                      An attenuation of 0 dB would mean the signal would pass with no reduction in amplitude while a large negative dB would indicate a very small amplitude ratio (at -10 dB of attenuation we would have an amplitude ratio of 0.32).

                      The ideal filter would be designed to pass all signals with 0 dB of attenuation below a cut-off frequency and completely attenuate all frequency components above the cut-off frequency. This ideal filter does not exist in the real world. -3 dB of signal attenuation has been established as the cut-off frequency in filter selection. Figure 3-8 illustrates the effect of a filter with a 3 Hz cut-off frequency on a noisy 1.2 Hz signal. Where a filter is selected by choosing cut-off frequency, select that is above the frequency of your process value.

Selecting a Filter by Time Constant
The effect of a low pass filter is to introduce a first order lag in the process variable response.

Low pass filters may sometimes be referred to as first order lag filters.

Some filters are configured by selecting a time constant for the lag response of the filter. The relationship between the cut-off frequency and the time constant of a low pass is approximately given by:

                  Cut - Off Frequency ≈ .1/ 5 Time Constants

For example, to configure a filter for a cut-off frequency of 60 Hz specify a filter time constant of  seconds
                                      Time Constant ≈ 1/5 Cut - Off Frequency =1/5*60 =0.0033

Bellow Figure shows the step response of the 3 Hz filter illustrating the filter time constant of 0.068 seconds.


Monday 23 May 2016

Basics of Process Control

What is Open Loop Control?

In open loop control the controller output is not a function of the process variable.In open loop control we are not concerned that a particular Set Point be maintained, the controller output is fixed at a value until it is changed by an operator. Many processes are stable in an open loop control mode and will maintain the process variable at a value in the absence of a disturbance.


Disturbances are uncontrolled changes in the process inputs or resources.

                         However, all processes experience disturbances and with open loop control this will always result in deviations in the process variable; and there are certain processes that are only stable at a given set of conditions and disturbances will cause these processes to become unstable. But for some processes open loop control is sufficient. Cooking on a stove top is an obvious example. The cooking element is fixed at high, medium or low without regard to the actual temperature of what we are cooking. In these processes, an example of open loop control would be the slide gate position on the discharge of a continuous mixer or ingredient bin.

Figure 1-1 depicts the now familiar heat exchanger. This is a stable process, and given no disturbances we would find that the process variable would stabilize at a value for a given valve position, say 110°F when the valve was 50% open. Furthermore, the temperature would remain at 110°F as long as there were no disturbances to the process.

                                                                       Figure 1-1


   However, if we had a fluctuation in steam supply pressure, or if the temperature of the water entering the heat exchanger were to change (this would be especially true for recirculation systems with a sudden change in demand) we would find that the process would move to a new point of stability with a new exit temperature.


What is Closed Loop Control?

                       In closed loop control the controller output is determined by difference between the process variable and the Set Point. Closed loop control is also called feedback or regulatory control.
The output of a closed loop controller is a function of the error.

         Error is the deviation of the process variable from the Set Point and is defined as
                                                                    E = SP - PV.

A block diagram of a process under closed loop control is shown in figure 1-2


                                                                        Figure 1-2

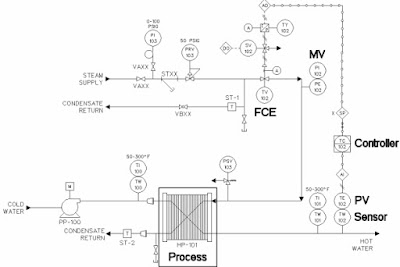
                            An important point of this illustration is that the process, from the controller’s perspective, is larger than just the transformation from cold to hot water within the heat exchanger. From the controllers perspective the process encompasses the RTD, the steam control valve and signal processing of the PV and CO values.

                           How the valve responds to the controller output and its corresponding effect on the manipulated variable (steam pressure) will determine the final effect on the process variable (temperature). The quality and responsiveness of the temperature measurement directly effects how the controller sees its effect on the process. Any filtering to diminish the effects of noise will paint a different picture of the process that the controller sees.

                          The dynamic behaviors of all of the elements in a control loop superimpose to form a single image of the process that is presented to the controller. To control the process requires some understanding of each of these elements.

Figure 1-3 depicts the heat exchanger under closed loop control.

Figure 1-3


What are the Modes of Closed Loop Control?
                          Closed loop control can be Manual, On-Off, PID, Advanced PID (ratio, cascade, feed-forward) or Model Based depending on the algorithm that determines the controller output based on the error.

Manual Control:
                          In manual control an operator directly manipulates the controller output to the final control element to maintain a Set Point.

                          In Figure 1-4 we have placed an operator at the steam valve of the heat exchanger. Their only duty is to look at the temperature of the water exiting the heat exchanger and adjust the steam valve accordingly; we have a manual control system.

                        While such a system would work, it is costly (we're employing someone to just turn a valve), the effectiveness depends on the experience of the operator, and as soon as the operator walks away we are in open loop.

Figure 1-4


On-Off Control: On-Off control provides a controller output of either on or off in response to error.

              As an on-off controller only proves a controller output hat is either on or off, on-off control requires final control elements that have two command positions: on-off, open-closed.

              In Figure 1-5 we have replaced the operator with a thermostat and installed an open-close actuator on the steam valve, we have implemented on-off control.

Figure 1-5

                           As the controller output can only be either on or off, the steam control valve will be either open or closed depending on the thermostat's control algorithm. For this example we know the thermostat's controller output must be on when the process variable is below the Set Point; and we know the thermostat's controller output must be off when the process variable is above the Set Point.

                     But what about when the process variable is equal to the Set Point? The controller output cannot be both on and off.

                    On-off controllers separate the point at which the controller changes its output by a value called the deadband (see Figure 1-6).

Figure 1-5

                 Upon changing the direction of the controller output, deadband is the value that must be traversed before the controller output will change its direction again.

                On the heat exchanger, if the thermostat is configured with a 110°F Set Point and a 20°F deadband, the steam valve will open at 100°F and close at 120°F. If such a large fluctuation from the Set Point is acceptable, then the process is under control.

                If this fluctuation is not acceptable we can decrease the deadband, but in doing so the steam valve
will cycle more rapidly, increasing the wear and tear on the valve, and we will never eliminate the error (remember, the thermostat cannot be both on and off at 110F).


PID Control: PID control provides a controller output that modulates from 0 to 100% in response to error.

                    As an on-off controller only proves a controller output that is either on or off, on-off control requires devices that have two command positions: on-off, open-closed.

                    As a PID controller provides a modulating controller output, PID control requires final control
elements that have can accept a range of command values, such as valve position or pump speed.

To modulate is to vary the amplitude of a signal or a position between two fixed points.

                    The advantage of PID control over on-off Control is the ability to operate the process with smaller error (no deadband) with less wear and tear on the final control elements.


Figure 1-6

Time Proportion Control:
                             Time proportion control is a variant of PID control that modulates the on-off time of a final control element that only has two command positions.

                             To achieve the effect of PID control the switching frequency of the device is modulated in response to error. This is achieved by introducing the concept of cycle time.

                             Cycle Time is the time base of the signal the final control element will receive from the controller. The PID controller determines the final signal to the controller by multiplying the cycle time by the output of the PID algorithm.

                             In Figure 1-7 we have a time proportion controller with a cycle time of 10 seconds. When the PID algorithm has an output of 100% the signal to the final control element will be on for 10 seconds and then repeat. If the PID algorithm computes a 70% output the signal to the final control element will be on for 7 seconds and off for 3 and then repeat.


Figure 1-7

                           While time proportion control can give you the benefits of PID control with less expensive final control elements it does so at the expense of wear and tear on those final control elements.Where used, output limiting should be configured on the controller to inhibit high frequency switching of the final control element at low controller outputs.


What are the Basic Elements of Process Control?
                            Controlling a process requires knowledge of four basic elements, the process itself, the sensor that measures the process value, the final control element that changes the manipulated variable, and the controller.

Figure 1-8

The Process: 
                   We have learned that processes have a dynamic behavior that is determined by physical properties; as such they cannot be altered without making a physical change to the process.

Sensors
                   Sensors measure the value of the process output that we wish to effect. This measurement is called the Process Variable or PV. Typical Process Variables that we measure are temperature, pressure, mass, flow and level. The Sensors we use to measure these values are RTDs, pressure gauges and transducers, load cells, flow meters and level probes.

Final Control Elements: 
                   A Final Control Element is the physical device that receives commands from the controller to manipulate the resource. Typical Final Control Elements used in these processes are valves and pumps.

The Controller: 
                    A Controller provides the signal to the final element. A controller can be a person, a switch, a single loop controller, or DCS / PLC system. 

Introduction to Process Control

Introduction

Why do we need Process Control?

                              Effective process control is required to maintain safe operations, quality products, and business viability.

Safety: The primary purpose of a Process Control system is safety: personnel safety, environmental safety and equipment safety. The safety of plant personnel and the community is the highest priority in any operation. An example of safety in a common heat exchanger process is the installation of a pressure relief valve in the steam supply. Other examples of safety incorporated into process control systems are rupture disks and blow out panels, a pressure switch that does not allow a pump to over pressurize a pipe or a temperature switch that does not allow the fluid flowing through a heat exchanger to overheat.

Quality: In addition to safety, process control systems are central to maintaining product quality. In blending and batching operations, control systems maintain the proper ratio of ingredients to deliver a consistent product. They tightly regulate temperatures to deliver consistent solids in cooking systems. Without this type of control, products would vary and undermine quality.

Profit: When safety and quality concerns are met, process control objectives can be focused on profit.
All processes experience variations and product quality demands that we operate within constraints. A batch system may require +- 0.5% tolerance on each ingredient addition to maintain quality. A cook system may require +- 0.5 degrees on the exit temperature to maintain quality. Profits will be maximized the closer the process is operated to these constraints. The real challenge in process control is to do so safely without compromising product quality.


                                                  Copyright Control Station


What is a Process?
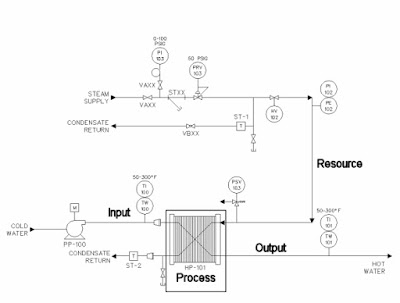
                      A process is broadly defined as an operation that uses resources to transform inputs into outputs. It is the resource that provides the energy into the process for the transformation to occur.

Figure 1-3

Figure 1-4 shows a hot water generation process commonly found in plants. The input to this process is cold water and the output of the process is hot water. Steam is the resource that provides energy for the transformation to occur within the heat exchanger plates.
Figure 1-4

Most plants operate multiple types of processes, including separation, blending, heating, and cooling to name a few. Each process exhibits a particular dynamic (time varying) behavior that governs the transformation, that is, how do changes in the resource or inputs over time affect the transformation. This dynamic behavior is determined by the physical properties of the inputs, the resource and the process itself. A typical heat exchanger process contains a plate and frame heat exchanger to transfer the heat from the steam to the incoming water. The properties of the incoming water (temperature), the steam (pressure) and properties of the specific heat exchanger used (surface area, efficiency of heat transfer) will determine the dynamic behavior, that is; how will the output be affected by changes in water temperature or steam pressure (flow)?


What is Process Control?

                              Process control is the act of controlling a final control element to change the manipulated variable to maintain the process variable at a desired Set Point.

                            A corollary to the definition of process control is a controllable process must behave in a predictable manner. For a given change in the manipulated variable the process variable must respond in a predictable and consistent manner. Following are definitions of some terms we will be using in out discussion of process control:

  • The manipulated variable (MV) is a measure of resource being fed into the process, for instance how much thermal energy.
  • A final control element (FCE) is the device that changes the value of the manipulated variable.
  • The controller output (CO) is the signal from the controller to the final control element. 
  • The process variable (PV) is a measure of the process output that changes in response to changes in the manipulated variable.
  • The Set Point (SP) is the value at which we whish to maintain the process variable at.

Figure 1-5 shows a block diagram of a process with a final control element and sensors to measure the manipulated variable and process variable. In single loop control systems the actual value of the manipulated variable is often not measured, the value of the process variable is the only concern.

Figure 1-5


Figure 1-6 shows a heat exchanger. We see that the manipulated variable (MV) is steam pressure. The final control element is the valve, by changing the valve opening we are changing the flow of steam which we can measure by its pressure. The process variable (PV) is the temperature of the water exiting the heat exchanger; this is the measure of the process output that responds to changes in the flow of steam.
Figure 1-6


                        This is a controllable process because opening the valve will always lead to an increase in temperature, conversely closing the valve will always lead to a decrease in temperature. If this were not true, if sometimes on closing the valve we had an increase in temperature, the process would not be controllable.

Sunday 22 May 2016

Instrumentation Basics

Introduction:
                      You cannot control what you cannot measure. Sensors are the foundation of Feedback Control. Sensors measure the process variable and transmit a signal that represents the measurement to the Controller. The quality of performance of the system is directly related to the performance of the sensor.

                      The process variables we measure most often are temperature, pressure, level, flow and mass. No sensor measures a process variable directly. Each sensor measures the effect of the process variable by physical position, force, voltage or some other more easily measured property.


What are Sensors and Transducers?

Sensors: A sensor is a device that has a characteristic that changes in a predictable way when
exposed to the stimulus it was designed to detect.

               When making process measurements we are not really measuring the value of the process variable. We are inferring the value of the process variable by measuring the response of a sensor to the process. Sensors have a physical property that changes in a measurable and consistent fashion.

                For example, when measuring temperature we are not directly measuring the temperature of an
object, we are measuring a sensors change in resistance or the amount of voltage it produces from being exposed to a temperature.

Transducers: A transducer is a device that converts one form of energy into another.

                  Transducers are used to convert the output of a sensor into a signal that a controller can use. The
output of a sensor may be a mechanical movement, or a change in size or position, or a nonstandard electrical signal. The output of a sensor may even be nonlinear. A transducer will convert the output of the sensor into a standard signal that a controller can use.

A sensor and transducer may be packaged together as shown in bellow figure

Or the transducer may be part of the controller as shown in bellow Figure

For the sake of convenience we will refer to any device that measures a process variable as an instrument, understanding that some signal processing will take place


What are the Standard Instrumentation Signals

                              Standard instrument signals for controllers to accept as inputs from instrumentation and outputs to final control elements are pneumatic, current loop and 0 to 10 volt.

Pneumatic: 
                              Before 1960 pneumatic signals were used almost exclusively to transmit measurement  & control information. Today we still commonly find 3 to 15 psig used as the final signal to a modulating valve.

                             Where the final control element requires a pneumatic signal, in most cases the controller outputs a standard electrical signal and a transducer between the controller and the final control element
converts the signal to 3 to 15 psig.

                             Most often an I/P (I to P) transducer is used. This converts a 4-20 mA signal (I) into a pressure signal (P).

This conversion process is normally linear where the pneumatic signal is given by
                              Signal psig = (% Controller Output x 12 psig)+ 3psig .

If the controller output is 40%, then the pneumatic signal from the I/P transducer is
                              Signal psig = (40% x 12 psig)+ 3psig = 4.8psig + 3psig = 7.8psig .

Current Loop: 
                                4-20 milliamp current loops are the signal workhorses in many processes. A DC milliamp current is transmitted through a pair of wires from a sensor to a controller or from a controller to its final control element. Current loops are used because of their immunity to noise and the distances that the signal can be transmitted. Since the signal being transmitted is current the voltage drop that occurs across conductors does not affect the signal, it just limits the length of the signal cable; and induced voltages do not affect the signal.

Loop Scaling: 
                           The level of the current in the loop is related to the value of the process variable or the controller output. How the current level and process value are related is the loop scaling.

Output Scaling: 
                           Scale outputs for a one to one correspondence. That is the controller output is configured for 0% to correspond to a 4mA signal and 100% to correspond to a 20mA signal. The final control element is calibrated so that 4mA corresponds to its 0% position or speed and 20mA corresponds to its 100% position or speed.

Input Scaling: 
                          Scale inputs for a one to one correspondence as well. If we were using a pressure transducer with a required operating range of 0 psig to 100 psig we would calibrate the instrument such that 0 psig would correspond to 4mA output and 100 psig would correspond to a 20mA output. At the controller we would configure the input such that 4mA would correspond to an internal value of 0 psig and 10mA would correspond to an internal value of 100 psig.

0 - 10 V: 
                        0 to 10 volt is not commonly used in many control systems because this signal is susceptible to induced noise and the distance of the instrument or final control element is limited due to voltage drop. You may find 0-10 volt signals used in control systems providing the speed reference to variable speed drives. For this application the cabling from the controller to the drive is typically confined to a control panel, meaning the cabling distances are short and electrical noise is more easily controlled.


What are Smart Transmitters?

                        Pneumatic, current loop and 0-10 volt signals are all analog signals. They are capable of
transmitting a signal that is continuous over its range, but the signal that is transmitted can only
represent a single value and the communication is only one way.

                       A smart transmitter is a digital device that converts the analog information from a sensor into digital information, which allows the device to simultaneously send and receive information and transmit more than a single value.

Smart transmitters, in general, have the following common features:

1. Digital Communications

2. Configuration

3. Re-Ranging

4. Signal Conditioning

5. Self-Diagnosis

Digital Communications: 
                              Smart transmitters are capable of digital communications with both its configuration device and a process controller. Digital communications have the advantage of being free of bit errors, the ability to monitor multiple process values and diagnostic information and the ability to receive commands. Some smart transmitters use a shared channel for analog and digital data (Hart, Honeywell or Modbus over 4-20mA), others use a dedicated communication bus (Profibus, Foundation Fieldbus, DeviceNet, Ethernet). 

Most smart instruments wired to multi-channel input cards require isolated inputs for the digital communications to work.

Configuration
                 Smart transmitters can be configured with a handheld terminal and store the configuration settings in nonvolatile memory.

Signal Conditioning
                Smart transmitters can perform noise filtering and can provide different signal characterizations.

Self-Diagnosis
                Smart transmitters also have self-diagnostic capability and can report malfunctions that may indicate erroneous process values.

What Instrument Properties Affect a Process?

 Some instrument properties that can affect the performance of your control system include:

  •  The instrument’s range and span.
  •  The resolution of the measurement.
  •  The instrument’s accuracy and precision.
  •  The instrument’s dynamics.

Range and Span:
                 The range of a sensor is the lowest and highest values it can measure within its specification.

An RTD may have a specified range of -200oC to +560oC.
A temperature transducer with an RTD sensor may have a specified range of -10oC to +65oC.

                  The span of a sensor is the high end of the Range minus the low end of the Range.

The RTD with a range of -200oC to +560oC would have a span of 760oC.
The RTD transducer with a range of -10oC to +65oC would have a span of 75oC.

Match Range to Expected Conditions
                      Instruments should be selected with a range that includes all values a process will normally
encounter, including expected disturbances and possible failures. 

                      In Chapter Two we learned that an instrument with too wide of an operating span will lower the process gain, possibly hiding an oversized final control element and requiring higher controller gains. Also, for most instruments operating ranges larger than required reduce the accuracy of the measurement.

                      In the heat exchanger example we could reasonably expect that the water temperature would
always be between 0oC and 100oC (frozen water will not flow and the system is designed so that we cannot superheat the water). Matching a temperature transmitter closely to this range will give us the best measurement performance.

Measurement Resolution
                    Resolution is the smallest amount of input signal change that the instrument can detect reliably.

                 Resolution is really a function of the instrument span and the controller’s input capability. Most controllers convert their analog input signals into a digital equivalent. The resolution of the measurement is determined by the span of the measurement and the number of bits in the digital conversion process.

                 Most current controllers resolve their analog inputs into 16 bits of digital information. 16 bits of
information allows for 65,535 values with which to represent the input signal.

The resolution of a 16 bit conversion is Input Span / 65,535.

If we have a 4-20 mA signal that represents a 0 to 100 psig process value, the input resolution is  
 100 psig      / 65,535 = 0.0015 psig.

                     Some older control systems may have input processing that only resolves their inputs into 12 bits of digital information. 12 bits will only allow for 4095 values with which to represent the process signal which is 16 times less resolution than a 16 it conversion.

No matter how many bits are used for the conversion process, the larger your instrument span, the
lower the resolution of your measurement.

Accuracy and Precision
                       Accuracy of a measurement describes how close the measurement approaches the true value of the process variable.

Accuracy is often expressed as a % error over a range or an absolute error over a range.
% Error Over a Range
                      Accuracy may be specified as ± a percentage over a range, span or full scale of an instrument.
The uncertainty in your measurement will be the percentage times the range specified by the manufacturer.

For example, Manufacturer A specifies that their pressure instrument has an accuracy of ±0.4% of full scale. The full scale of their instrument is 500 psig. We can expect the measurement signal from this instrument to be accurate to 2 psig for all pressures in the instruments range.
                                          0.4% x 500 psig = 0.004 x 500 psig = 2 psig
Even if we span the instrument for the application to 0 to 100 psig the instrument is still only accurate to 2 psig.

Absolute Over a Range
Accuracy may also be specified as ± an absolute value over a range.

Manufacturer B specifies that their pressure instrument has an accuracy of ±1 psig over the full operating range. The full scale of their instrument is also 500 psig. We can expect the measurement signal from this instrument to be accurate to 1 psig for all pressures in the instruments range.

In any case, the sensors we select must be more accurate then the degree to which we want to control the process. There is no amount of control loop tuning you can do on a process to maintain 30 psig ± 1 psig pressure instrument is only accurate to ± 2 psig.

Precision is the reproducibility with which repeated measurements can be made under identical conditions.

Precision may also be referred to as stability or drift. Precision is always required for good control, even when accuracy is not required.

The distinction between accuracy and precision is illustrated in Figure 3-3. The dashed line represents the actual temperature being measured. The upper line represents a precise but inaccurate value from an instrument; the lower line represents an accurate but imprecise measurement from an instrument.

Precision is the more important characteristic of an instrument.

Instrumentation Dynamics
                   Instruments have dynamic properties just as process do. The dynamic properties instruments
posses are identical to process dynamics: gain, time constants and dead time. All of these instrument dynamics contribute to the process dynamics that the controller sees.

Instrument Gain
                  The gain of an instrument is often call sensitivity. The sensitivity of a sensor is the ratio of the output signal to the change in process variable.

                  For a thermocouple the typical sensitivity is 5 mV per °C. This means for every °C change in the
process variable the thermocouple will change its output by 5 mV.

Instrument Time Constants:
                   As for processes, one time constant for an instrument is the time it takes to provide a signal that
represents 63.2% of the value of variable it is measuring after a step change in the variable. Instrument manufacturers may sometimes specify the rise time instead of the time constant.

                   Rise time is the time it takes for an instrument to provide a signal that represents 100% of the value of the variable it is measuring after a step change in the variable. The rise time of an instrument is equal to 5 time constants

Instrument Dead Time
The dead time of an instrument is the time it takes for an instrument to start reacting to process change.


What is Input Aliasing?
                      Input aliasing is a phenomenon that occurs from digital processing of a signal. When a signal is
processed digitally it is sampled at discrete intervals of time. If the frequency at which a signal is sampled is not fast enough the digital representation of that signal will not be correct. Input aliasing is an important consideration in digital process control. Processor inputs that have configurable sample rates and PID loop update times must be set correctly.
Above figure shows a low frequency 2 Hz signal that was sampled every 0.4 seconds. The resulting
curve from the sampled points looks nothing like the original. If this was the signal for the process variable then we would be unable to achieve control.

Correct Sampling Frequency
                   Fortunately establishing the correct sampling rate for a signal is not a trial and error procedure.
There is a well established theorem (Nyquist Frequency Theorem) that tells us to correctly sample a waveform it is necessary to sample at least twice as fast has the highest frequency in the waveform. In the digital world this means sampling at 1/20th of the period of the waveform. The 2 Hz signal in Figure 3-4 has a period of 1/2Hz = 0.5 seconds per cycle. To sample this in the digital world the sampling interval would be 0.5/20 seconds = 0.025 seconds. bellow Figure shows the same waveform sampled at this interval. Notice the match between the real and sampled signal.

Determining the Correct Sampling Interval
                  While it’s nice to know there is guidance on how to set the sample interval for a waveform based
on its frequency, how does one know what the frequency of a process variable is?

                  When it comes to instrumentation, it’s not the frequency that’s important, it’s the time constant.
Figure 3-6 is a graph of the response of an instrument with a 5 second time constant (25 second rise time). The signal from the instrument was sampled at 1 second intervals.

One rule of thumb would be to set the sample interval for an instrument at 1/10th to 1/20th of the rise time (1/2 to 1/4th of the time constant).

Another rule of thumb would be to set the sample interval to 1/10th to 1/20th of the process time constant.

                 Temperature instrumentation (RTDs and thermocouples in thermowells) typically have time constants of several seconds or more. For these processes sampling intervals of 1 second are usually sufficient.

Pressure and flow instrumentation typically have time constants of ½ to 1 second. For these processes sampling intervals of 0.1 second are usually sufficient.

About Transmitters

What are transmitters?
                               A transmitter is a device which converts the reading from a primary sensor or transducer into a standard signal and transmits that signal to a monitor or controller. The methods of successfully transmitting the data to the control room are listed below [1].

Types of signals used by transmitters:
                             There are three kinds of signals that are present in the process industry to transmit the reading of a process variable from the instrument to the centralized control system. These are,
1. Pneumatic signals
2. Analog signals
3. Digital signals

1. Pneumatic signals:
                            These are the signals produced by changing the air pressure in the signal pipe in proportion to the measured change in a process variable. The pneumatic signal range which is the common industrial standard is 3-15 psig. The 3 corresponds to the lower range value (LRV) and the 15 corresponds to the upper range value (URV). It is still a very commonly used signal type. However, since the invention of electronic instruments in the 1960s, the lower costs involved in running electrical signal wire through a plant as opposed to running pressurized air tubes has made pneumatic signal technology less popular[1].
                                          Figure 1: Pneumatic type Pressure Transmitter

2. Analog signals:
                          It is an electrical signal whose current’s or voltage’s magnitude represents some physical measurement or control quantity. An instrument is often classified as being “analog” simply by virtue of using an analog signal standard to communicate information, even if the internal construction and design of the instrument may be mostly digital in nature.
                          The most common standard for transmitting an analog signal is the 4-20 mA current signals. With this signal, a transmitter sends a small current through a set of wires. The signal generated is a kind of a gauge in which 4 mA represents the lowest possible measurement, or zero, and 20 mA represents the highest possible measurement [2].

Example: Consider a process that must be maintained at 100 °C. An RTD temperature sensor and transmitter are installed in the process vessel, and the transmitter is set to produce a 4 mA signal when the process temperature is at 95 °C and a 20 mA signal when the process temperature is at 105 °C. The transmitter will transmit a 12 mA signal when the temperature is at the 100 °C set point. As the sensor’s resistance property changes in response to changes in temperature, the transmitter outputs a 4–20 mA signal that is proportional to the temperature changes. The signal transmitted can be converted to a temperature reading or an input to a control device.

Why is this analogue signal conditioning required?
                            Traditionally, data acquisition systems have acquired analog data in the form of temperatures, accelerations, strains, positions, etc. This type of data has always required analog signal conditioning in order for the data system to accept it as an input source. For example, the full-scale output of a transducer may be in the range of 0-20mVDC where the input range to the data system is 0-5Vdc. In this case, it must be noted that voltage amplification is required [3].

Amplifiers are considered to be the most common piece of signal conditioning equipment because of their wide range of uses, such as amplification, attenuation, DC-shifting, impedance matching, isolation, and others. The instrumentation amplifier amplifies the difference between two signals.


Wheatstone bridge:
                                   Another very important device in instrumentation systems, the Wheatstone bridges are normally associated with strain gages but are also used as bridge completion networks for resistive transducers such as Resistive Temperature Devices (RTDs). The Wheatstone bridge consists of four resistances, R1-R4 and a voltage source V for exciting the bridge. The transducer is placed in one arm of the bridge with a steady-state resistance equal to the other three resistances. Therefore, only when the transducer’s steady-state resistance changes, there is an output of the bridge.

3. Digital Signals:
                                       The most recent addition to process signal control technology are the digital signals. Digital signals are discrete levels or values that are combined in specific ways to represent process variables and also carry other information, such as diagnostic information. The methodology used to combine the digital signals is referred to as protocol. Digital signal conditioning can be considered as changing one form of digital data to another form. An example would be the serial-toparallel or parallel-to-serial conversion. Some even consider the analog-to-digital conversion as digital signal conditioning.
                                        Digital multiplexing can also be considered as digital signal conditioning, one type of digital data is transformed into another type. Another form of digital signal conditioning related toI nstrumentation systems is digital filtering. There are two forms of digital filters. They are the finite impulse response (FIR) filters and the infinite impulse response (IIR) filters[4].


Telemetry:
                                    Telemetering is the reproduction, at a convenient location, of measurements makes at remote point. It is the method of getting information from one point to the other. The telemetry system can be defined as everything required to converting baseband data to radio frequency (RF) data and back again at some different location. This includes modulation of the information signal to an RF carrier, transmission, acquiring, receiving, and demodulation of the signal back into its original baseband form. Telemetry system components from the test vehicle side include the information signal, any required encryption or pre-modulation filtering, a telemetry transmitter, a power splitter if required, and vehicle antenna(s). Telemetry system components on the receiving side include reception antenna(s), pre-amps and splitters, telemetry receiver, demodulator, decryptor and bit synchronizer, if required[5].

In general, a telemetring system consists of:
(1) A measuring instrument which may measure flow, liquid level, pressure, temperature or any other variable.
(2) A conversion element that converts the measured variable into a proportional air pressure and electrical quantity.
(3) The pressure lines or connecting wires which may carry the transmitted variable from the transmitter to the receiver.
(4) A receiver which indicates the size of the transmitted variable and may also record or control the measured variable.

Transmission channel [5]:
                                       As soon as the data leaves the test vehicle in the form of a modulated RF carrier through a telemetry antenna, it will experience anomalies associated with the transmission medium. This medium is normally air. Most transmission antennas on test vehicles are omni directional, which means the transmitted signal is sent in all directions. When more than one path, or ray, makes it into the receive antenna feed, multipath effects may occur. Most of the time, there is one dominant ray received due to the narrow beamwidth of the receive antenna. When one or more of these reflected paths, caused by terrain variations between the test vehicle and receive antenna, are within the beam width of the antenna, it can either add constructively or destructively to the direct ray.

Receiving station:
The role of the receiving station is to receive the transmitted signal and to recreate the original data on the ground.

TRANSMITTERS IN PROCESS INDUSTRIES:

The types of transmitters used in Process Industries include:

1. Pressure transmitters

2. Temperature transmitters

3. Flow transmitters

4. Level transmitters


5. Analytic (O2 [oxygen], CO [carbon monoxide], and pH) transmitters

Pressure transmitters [6]:


The types of different pressure transmitters used in industries are,

1. Absolute pressure transmitter:
This transmitter measures the pressure relative to perfect vacuum pressure (0 psi or no pressure).

2. Gauge pressure transmitter:
This transmitter measures the pressure relative to a given atmospheric pressure at a given location. When the pressure gauge reads 0 PSI, it is really atmospheric pressure.

3. Differential Pressure transmitter:
This transmitter measures the difference between two or more pressures introduced as inputs to the sensing unit, for example, measuring the pressure drop across an oil filter. Differential pressure is also used to measure flow or level in pressurized vessels.

4. Electronic pressure transmitters

5. Pneumatic pressure transmitters

6. Submersible pressure transmitters

7. Digital pressure transmitters

8. Wireless pressure transmitters

Level transmitters [7]:

Level transmitters are used to measure the level of a liquid or solid material within a space, and to provide information about these measurements that are proportional to the input level. These transmitters can measure the level continuously or at determined points.

Point level transmitters provide output when a specific level measurement is reached. This output is generally in the form of an audible alarm or an electrical charge to turn on a switch.

Continuous level transmitters measure level within a specified range and provide output as a continuous reading of the level.

Different types of level transmitters are,
1. Ultrasonic:
Ultrasonic level transmitters are used for non-contact level sensing of highly viscous liquids, as well as bulk solids. They are also widely used in water treatment applications for pump control and open channel flow measurement.
2. Conductive:
These use a low-voltage, current-limited power source applied across separate electrodes. These are ideal for the point level detection of a wide range of conductive liquids such as water, and is especially well suited for highly corrosive liquids such as caustic soda, hydrochloric acid, nitric acid, ferric chloride, and similar liquids.
3. Pneumatic:
These transmitters are intended to be used in hazardous environments, where there is no electric power or its use is restricted, and in applications involving heavy sludge or slurry.

4. Capacitance

5. Magnetic tracking


6. Hydrostatic


Temperature transmitters [8]: 


A temperature transmitter is a device that captures a signal from a sensor such as a thermocouple or RTD, calculates the temperature based on this signal, and then converts it to a 4-20 mA type of signal for output to a receiving device.

 There are some types of temperature transmitters. They are,

1. Thermocouple type: 
                                  When a thermocouple is used, the temperature transmitter measures the electromotive force and terminal block temperature, and uses this electromotive force data to calculate the temperature.

2. RTD type:

When an RTD is used, the temperature transmitter passes a very small electric current through the RTD to measure electrical resistance. Based on the relationship between resistance and temperature, it then calculates the temperature.

Top Instrumentation Engineering Questions & Answers

1. List any four objectives of process control.?
        Suppressing the influence of external disturbances, Optimizing the performance, Increasing the Productivity, Cost effective

2. Define process?
       Any system comprised of dynamic variables usually involved in manufacturing and production operations. It is defines as a series of operations during which some materials are placed in more useful state.

3. What is manipulated variable?
       It is a variable which is altered by the automatic control equipment so as to change the variable under and make it conform with the desired value.

4. Define Controlled variable?
       It is the quantity of control system which is directly measured and controlled.

5. What do you mean by self regulation?
        The output will move from one steady state to another for the sustained change in input. This means that for change in some input variable the output variable will rise until it reaches a steady state (inflow = outflow). It is the tendency of the process to adopt a specific value of controlled variable for nominal load with no control operations.

6. Why do we need mathematical modeling of process?
       The physical equipment of the chemical process we want to control have not been constructed. Consequently we cannot experiment to determine how the process reacts to various inputs and therefore we cannot design the appropr iate control system. If the process equipment needs to be available for experimentation the procedure is costly. Therefore we need a simple description of how the process reacts to various inputs, and this is what the mathematical models can provide to the control designer.

7. Name different test inputs?
       Step, Ramp, Impulse, Sinusoidal, Pulse inputs

8. Name a process giving inverse response?
       Drum boiler system, in which the flow rate of the cold feed water is increased by a step the total volume of the boiling water and consequently the liquid level will decreased for a short period and then it will start increasing.

9. Define interacting system and give an example?
       Load changes in first process affects the second process and vise versa when both are connected in series nature is called interacting system. Eg. Two level tanks are connected in series.


10. What is meant by non-self regulation?
       A system that grows without limit for a sustained change in input (constant outflow or outflow independent of inflow condition).

11. Write any two characteristics of first order process modeling?
       The smaller the value of time constant the steeper the initial response of the system. A first order lag proce ss is self regulating the ultimate value of the response equal to Kp (steady state gain of the process) for a unit step change in the input.

12. Distinguish between continuous process and batch process?
        A process in which the materials or work flows more or less continuously through a plant apparatus while being treated is termed as continuous process. The problem of continuous process is due to load changes. (e.g.) storage vessel control. A process in which the materials or work are stationary at one physical location while being treated is termed as batch process. (e.g.) furnace.

13. Explain the function of controller?
       The element in a process control loop that evaluated error of the controlled variable and initiates corrective action by a signal to the controlling variable.

14. What is the purpose of final control element?
      Components of a control system (such as valve) is used to directly regulates the flow of energy or materials to the process. It directly determines the value of manipulated variable.

15. Define Process control?
       It is the scheme that describes how much the manipulated variable should change inorder to bring the controlled variable back to the setpoint.

16. List the two types of process control?
     i) Direct process control – Controlled variable directly indicates the performance of the process
                                 Eg. Water heater system
    ii) In Direct Process control the performance of the process. – Controlled variable indirectly indicates
                                 Eg.  Annealing

17. What is Servo operation and Regulatory operation?
        If the purpose of the control system is to make the process follow the changes in setpoint as quick as possible, then it is servo operation.

18. What is mathematical modeling?
       Set of equations that characterize the process is termed as Mathematical Modelling.

19. Define an non-interacting system?
       The dynamic behaviour one tank is affected by the other, but the reverse is not true, then it is noninteracting system. Here the liquid heads are independent of each other.

20. Define an interacting system?
       The dynamic behavior one tank is affected by the other, but the reverse is also true, then it is noninteracting system. Here the liquid heads are dependent of each other.

21. Mention two drawbacks of derivative action?
     (i) The output of controller is zero at constant error condition.
     (ii)It will amplify the noise present in the error signal.

22. What are the steps involved to design a best controller?
       Define appropriate performance criterion (ISE, IAE, ITATE). Compute the value of the performance
criterion using a P, PI, or PID controller with the best setting for the adjusted parameters Kp, Ti, Td. Select controller which give the best value for the performance criterion.

23. Define proportional control mode?
        A controller mode in which the controller output is directly proportional to the error signal
                                               P=Kpep+p0 
     Where
            P-controller output
            Kp= Propotional gain,
            ep=error in percent of variable range,
            P0- Bias.

24. Define proportional band?
          Proportional band is def ined as the change in input of proportional controller mode required to produce a full-scale change in output

25. Define offset?
         It is the steady state deviation (error) resulting from a change in value of load variable.

26. Define error (deviation)?
        It is the difference at any instant between the value of controlled variable and the set point. E=S.PP.V

27. Why is the electronic controller preferred to pneumatic controller?
         Electronic signals operate over great distance without time lags. Electronic signals can be made compatible with digital controllers. Electronic devices can be designed to be essentially maintenance free. Intrinsic safety techniques eliminate electrical hazards. Less expensive to install. More energy efficient. Due to the above said properties electronic controllers are preferred to pneumatic controller.

28. Explain the function of controller.?
        The element in process control loop that evaluates error of the controlled variable and initiates corrective action by a signal to the controlling variable.

29. Write any two limitations of single speed floating control.?
        The present output depends on the time history of errors and such history is not known, the actual value of controller output floats at an undetermined value. If the deviation persists controller saturates at either 100% or 0% and remain there until an error drives it towards opposite extreme.